
South Bend Housing Market Update: October 2026 IRMLS Stats for South Bend, Mishawaka & Granger
This monthly snapshot draws primarily from the Indiana Association of REALTORS® (IAR) MLS Data Warehouse and IRMLS data for the South Bend area (St. Joseph County MSA). It covers September 2026 figures, the latest full month available, for median sale price, active and new listings, median days on market (to pending) and sale-to-list ratio across South Bend, Mishawaka and Granger. City-level details reflect recent MLS-derived trends (including Redfin compilations of MLS and public records data and local IRMLS pulls) where public county reports do not break out every metric by municipality. Overall county numbers provide the most consistent official baseline.
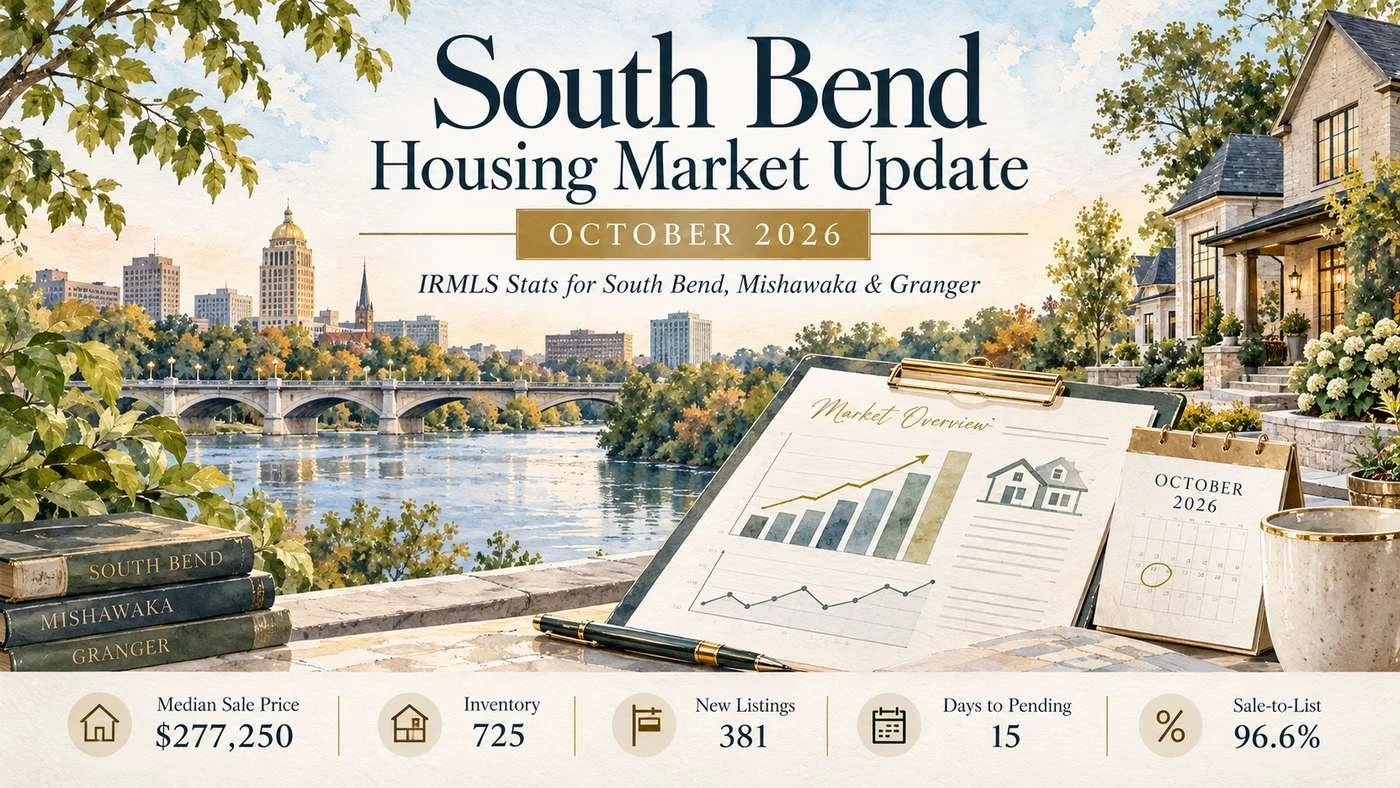
St. Joseph County at a glance: September 2026
Median sale price: $277,250 (+7% month over month, +13% year over year)
Average daily inventory: 725 homes (+6% MoM, +19% YoY)
New listings: 381 (+3% YoY)
Median days from listing to pending: 15 (+25% MoM, -25% YoY)
Sale-to-list ratio: 96.6% (+1% YoY)
Closed sales: 264 (-22% MoM, -5% YoY)
Months of inventory: 2.6 (+24% YoY)
South Bend, Mishawaka and Granger compared
City figures approximate recent three-month (August to September) MLS trends. Active listings are approximate portal counts as of early October 2026. Sale-to-list is the recent city average.
South Bend
Median sale price: about $200,000 (recent 3 months)
Active and new listings: the largest share of the county's 725 active listings, with elevated new listings
Median days on market: about 16
Sale-to-list ratio: about 98.7%
Trend: competitive, with prices up about 8% year over year and a lower entry point than Granger
Mishawaka
Median sale price: about $215,000 (recent 3 months)
Active and new listings: about 110 to 120 active, with steady new listings
Median days on market: about 16
Sale-to-list ratio: about 99.7%
Trend: the fastest and most competitive local market, with a strong sale-to-list ratio
Granger
Median sale price: about $435,000 (recent 3 months)
Active and new listings: about 150 or more active, with moderate new listings
Median days on market: about 18
Sale-to-list ratio: about 99.2%
Trend: the premium market, with higher prices, still competitive but slightly longer days on market
What the numbers mean
The South Bend area housing market in September 2026 remains competitive overall, with low months of inventory (2.6) supporting seller leverage even as inventory has risen year over year and closed sales softened modestly. Homes continue to move relatively quickly (a median of 15 days to pending county-wide, improved from a year ago), and the 96.6% sale-to-list ratio indicates limited but not extreme discounting. Sellers are generally achieving close to asking price when homes are priced correctly.
Differences among the three areas are clear and persistent. South Bend offers the most accessible entry points (recent medians around $200,000), with a large active inventory that gives buyers more choice but still competitive conditions (recent days on market near 16 and sale-to-list near 99%). Mishawaka stands out as especially tight and fast, with sale-to-list ratios near 100% and strong competition in the mid-price band. Granger remains the premium suburban market, with medians in the mid-$400,000s, solid demand, and slightly longer but still efficient marketing times. Well-priced homes there continue to attract multiple offers.
Sale-to-list ratios in the 96% to 99% range and median days on market under three weeks signal that accurate pricing is critical. Overpriced listings risk longer market times and eventual reductions, while correctly priced homes sell efficiently. Rising inventory (+19% year over year county-wide) and a slight month-over-month uptick in days on market give buyers modestly more negotiating room than in the peak spring months, particularly on homes that have been listed longer. For sellers, the market still favors those who price strategically and prepare their homes well. Buyers should be prepared to move quickly on desirable properties, get pre-approved, and watch higher-end Granger inventory for relative value.
Practical takeaways
Buyers: Inventory growth improves your options, especially in South Bend. Focus on well-priced homes to avoid bidding wars in Mishawaka and Granger.
Sellers: A strong sale-to-list ratio and quick days on market reward realistic pricing. The market remains seller-tilted but less frenzied than earlier in 2026.
Everyone: Local variation matters more than headline county numbers. Neighborhood-level comps drive outcomes.
Want numbers for your neighborhood?
County and city medians are a starting point. I'm Jennifer Lillie, a REALTOR® with Cressy & Everett Real Estate, and I can pull recent comparable sales for your street or the neighborhoods you're considering. Contact me or call 574-286-9667.
More South Bend market guides
Sources: Indiana Association of REALTORS® MLS Data Warehouse and IRMLS data for St. Joseph County, September 2026; city figures are approximate recent MLS-derived trends. Information is deemed reliable but not guaranteed and may change as late sales are reported.