
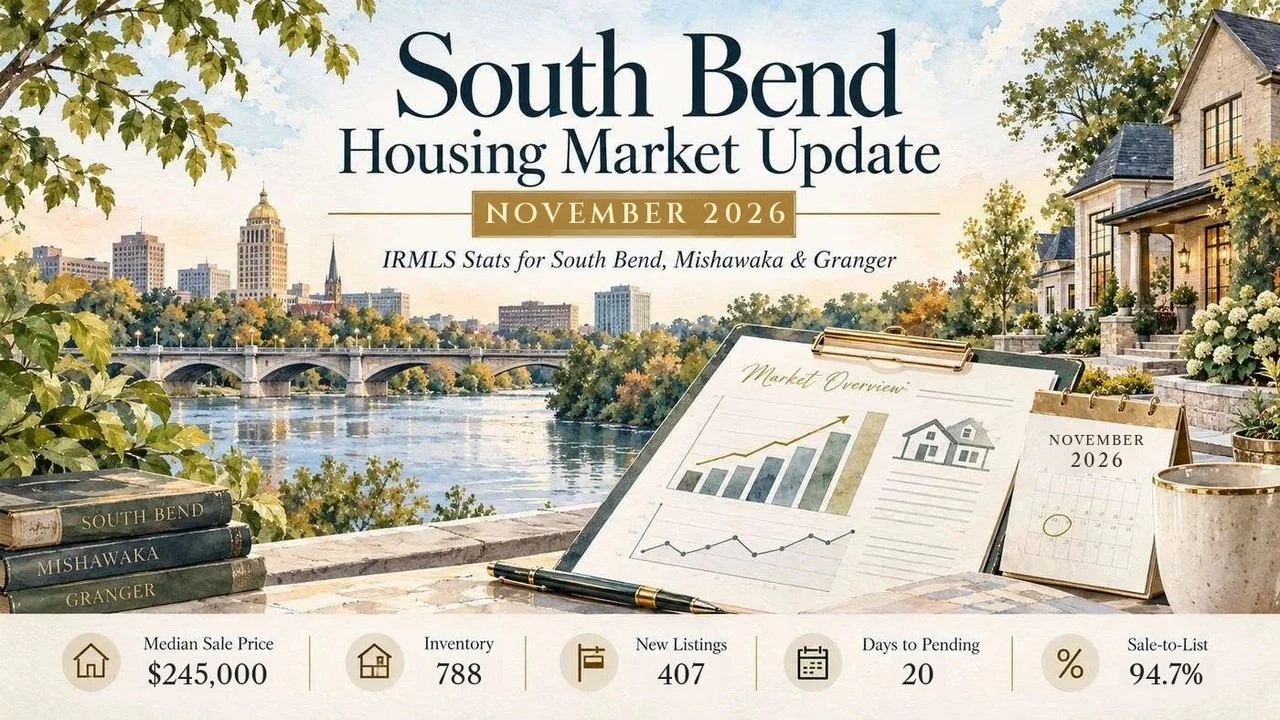
Here's my monthly look at the South Bend housing market, using October 2026 numbers, the latest full month available. In St. Joseph County, the median sale price was $245,000, homes took a median of 20 days to go pending, average daily inventory climbed to 788 homes, 407 new listings came on, and the sale-to-list ratio was 94.7%. The figures come from IRMLS data through the Indiana Association of REALTORS® (IAR) MLS Data Warehouse. In short, prices are still up from last year, but buyers have more homes to choose from and a little more time to decide.
St. Joseph County housing market at a glance: October 2026
Median sale price: $245,000 (-12% month over month, +6% year over year)
Average daily inventory: 788 homes (+9% MoM, +22% YoY)
New listings: 407 (+7% MoM, +4% YoY)
Median days from listing to pending: 20 (+33% MoM, +5% YoY)
Sale-to-list ratio: 94.7% (-2% MoM, flat YoY)
Closed sales: 271 (+3% MoM, -8% YoY)
New pending contracts: 232 (-8% MoM, -26% YoY)
Months of inventory: 2.9 (+9% MoM, +28% YoY)
South Bend, Mishawaka and Granger housing market compared
Data period: October 2026 (full month), all residential, IRMLS via the IAR MLS Data Warehouse. City figures use the township each community sits in, because that's how IAR publishes local data: Portage Township for South Bend, Penn Township for Mishawaka (it also includes Osceola), and Harris Township for Granger. IAR's public township pages show median sale price, new listings, closed sales and months of inventory, but not monthly days on market, sale-to-list or year-over-year changes, so those cells are marked n/a rather than estimated.
| Market | Median Sale Price | Active / New Listings | Median Days on Market | Sale-to-List Ratio | Notes / YoY Direction |
|---|---|---|---|---|---|
| South Bend (Portage Twp.) | $167,750 | n/a / 156 new | n/a | n/a | 102 closed sales (+17% MoM); median -6% MoM; 3.1 months of inventory; YoY n/a |
| Mishawaka (Penn Twp.) | $242,000 | n/a / 95 new | n/a | n/a | 58 closed sales (-17% MoM); median -16% MoM; 2.2 months of inventory; YoY n/a |
| Granger (Harris Twp.) | $340,000 | n/a / 26 new | n/a | n/a | 22 closed sales (flat MoM); median -20% MoM; 2.8 months of inventory; small sample; YoY n/a |
| St. Joseph County (reference) | $245,000 | 788 avg. daily active / 407 new | 20 | 94.7% | Median +6% YoY; inventory +22% YoY; closed sales -8% YoY |
South Bend
South Bend remains the most affordable entry point in the area, with an October median of $167,750 across 102 closed sales in Portage Township, the busiest of the three. It also had the most new listings (156) and the deepest supply at 3.1 months of inventory, so buyers here have the most choice right now.
Mishawaka
Mishawaka stayed the tightest of the three markets, at 2.2 months of inventory. The October median in Penn Township was $242,000 on 58 sales, with 95 new listings. Well-priced homes in the middle price range still move quickly.
Granger
Granger is still the premium market, with a $340,000 median in Harris Township. With only 22 closed sales, one month can swing the median quite a bit (the 46530 Granger ZIP code, which reaches a little beyond the township, showed a $358,000 median on 40 sales). Supply sat at 2.8 months, a bit looser than Mishawaka.
What the October numbers mean for the South Bend housing market
October looked like a normal fall slowdown, with more supply than a year ago. The county median dipped 12% from September's $277,250, which is typical as the mix of homes selling changes after summer, but it's still 6% higher than last October. Meanwhile, inventory is up 22% from a year ago, months of inventory reached 2.9, and new pending contracts fell 26% year over year. That combination tells me buyers are being more selective and sellers face more competition than they did last fall.
Here's what days on market and sale-to-list mean in plain terms. A median of 20 days to pending means half of homes went under contract within about three weeks. That's still fairly quick, but it's slower than September's 15. A 94.7% sale-to-list ratio means the typical buyer paid a little more than 5% under list price on average, which is a bit more negotiating room than we saw in September (96.6%). It matches last October, so this is a seasonal pattern, not a sudden shift.
The three areas differ in clear ways. South Bend gives buyers the most options at the lowest prices. Mishawaka is the tightest, with the least supply, so good homes still draw competition. Granger sits at the top of the price range with moderate supply, and its small number of sales makes month-to-month medians bounce around.
Takeaways for buyers and sellers
Buyers: You have more homes to choose from than a year ago and a bit more room to negotiate, especially on homes that have been listed for a few weeks. Get pre-approved so you can act quickly on the right home, especially in Mishawaka.
Sellers: Pricing and presentation matter more this fall. A 94.7% sale-to-list ratio and slower time to pending mean an overpriced home will likely sit. When a home is priced right from day one, it still sells in about three weeks.
Everyone: Neighborhood comps tell you far more than county headlines. Medians can swing from month to month, especially in smaller markets like Granger.
Want numbers for your neighborhood?
County and township medians are a good starting point. I'm Jennifer Lillie, a REALTOR® with Cressy & Everett Real Estate, and I'd be happy to pull recent comparable sales for your street or the neighborhoods you're considering in South Bend, Mishawaka or Granger. Email me at jen@jenlillie.com or call 574-286-9667.
More South Bend market guides
Sources: IRMLS data via the Indiana Association of REALTORS® MLS Data Warehouse (data.indianarealtors.com), October 2026, all residential. Data includes the St. Joseph County Monthly Market Report and the Portage, Penn and Harris Township and ZIP 46530 market dashboards, accessed November 12, 2026 (last updated November 7, 2026). Township figures stand in for city figures. Information is deemed reliable but not guaranteed and may change as late sales are reported.